
August 19, 2026
Simple rules, clear examples, and real-world tactics for trading ETFs across every asset class.
This trading playbook lays out a clear, practical framework you can use to execute ETF trades with confidence. It treats ETF liquidity as a function of the underlying holdings, not just fund size or screen volume.
That single shift in mindset changes everything. Once you look through the wrapper and focus on the basket, you start to see that a newer fund with deep, liquid holdings can often absorb size just as effectively as a long-tenured product with a large asset base. Whether you are placing a small ticket in a large-cap equity ETF or building a sizable position in a more specialized strategy, a disciplined process keeps costs and risks under control.
This playbook turns that process into a repeatable checklist you can use trade after trade.
Core Principles
Before you worry about order tickets and trading windows, you need a few core ideas locked in.
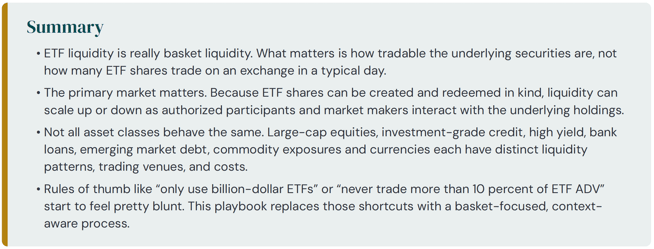
First, ETF liquidity is really basket liquidity. What matters is how tradable the underlying securities are, not how many ETF shares trade on an exchange in a typical day. A fund holding deep, heavily traded securities can often support much larger trades than its asset level or average daily volume might suggest.
Second, the primary market matters. Because ETF shares can be created and redeemed in kind, liquidity can scale up or down as authorized participants and market makers interact with the underlying holdings. In many cases, the “hidden” capacity in the primary market dwarfs what you see on the screen.
Third, not all asset classes behave the same. Large-cap equities, investment-grade credit, high yield, bank loans, emerging market debt, commodity exposures and currencies each have distinct liquidity patterns, trading venues, and costs. Treating them as if they share a single liquidity profile leads to shortcuts that break down in stress.
Once you internalize these principles, rules of thumb like “only use billion-dollar ETFs” or “never trade more than 10 percent of ETF ADV” start to feel pretty blunt. This playbook replaces those shortcuts with a basket-focused, context-aware process.
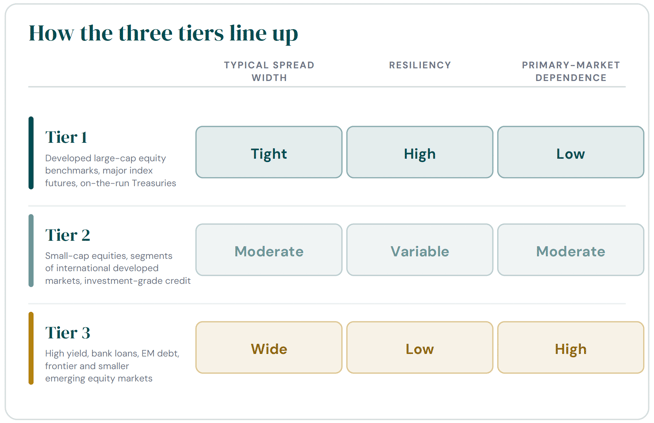
EXHIBIT 1 The three-tier liquidity framework at a glance. Tagging an exposure as Tier 1, 2 or 3 sets expectations on spread width, resiliency and how much the trade will lean on the primary market. Conceptual summary of the framework set out in this section.
Tier 1 exposures include developed large-cap equity benchmarks, major index futures, and highly liquid government bonds such as on-the-run Treasuries. These markets tend to have deep order books, tight spreads, and strong resiliency, which means liquidity refills quickly after shocks. For these trades, the ETF wrapper is rarely the constraint, and fund size typically sits well down the priority list.
Tier 2 exposures include small-cap equities, segments of international developed markets, and investment-grade corporate bonds. Here you see modestly wider spreads, more variable depth, and more sensitivity to timing and order type. These trades are still very manageable, but they demand more attention to how you stage execution and whether you involve a trading desk or capital markets contact.
Tier 3 exposures sit at the thin end of the spectrum. Think high-yield bonds, bank loans, emerging market debt and frontier or smaller emerging equity markets. Spreads are wider, liquidity can disappear quickly in stress, and primary-market capacity plus the credit profile of the basket often dominate your execution decisions. Even very well-known ETFs in these areas can be costly to trade in size if you ignore underlying constraints.
Once you tag a trade as Tier 1, 2, or 3, you set expectations early. You know whether you can use simple limit orders in the ETF, whether you should talk to an ETF trading specialist, or whether a full pre-trade liquidity review is mandatory.
STEP 1: Pre-Trade Analysis
Before you worry about order tickets and trading windows, you need a few core ideas locked in.
First, ETF liquidity is really basket liquidity. What matters is how tradable the underlying securities are, not how many ETF shares trade on an exchange in a typical day. A fund holding deep, heavily traded securities can often support much larger trades than its asset level or average daily volume might suggest.
CLARIFY TRADE OBJECTIVES
Start by writing down what you are actually trying to do. Not in your head. On paper or in your system.
Document trade size in dollars or shares, your urgency, and your benchmark. Are you trying to get a client allocation in place immediately at current levels, or can you work the order over a day or two. Is this a tactical move tied to a specific price, or a strategic shift where small slippage matters less than clean execution.
Being explicit about whether a trade is client driven with tight timing constraints or portfolio driven with more flexibility prevents you from drifting mid-trade. It also gives you a baseline to judge whether the final result met your own plan.
ASSESS ETF STRUCTURE
Next, look under the hood. How does the ETF get exposure.
Confirm whether the fund uses physical replication or derivatives and whether it tracks its index through full replication or sampling. In equity funds, this affects tracking and how easily trading desks can source the basket. In fixed income, it influences which bonds are actually held and how often they trade.
For bond ETFs, review the use of to-be-announced securities, repos or other financing tools that affect the liquidity profile. For commodity and currency funds, understand which futures contracts or swaps they use and how often those positions are rolled. These structural details matter for both trading costs and long-term performance.
EVALUATE BASKET LIQUIDITY
This is the heart of your pre-trade work. Basket first, wrapper second.
In equity ETFs, look at average daily dollar volume for major holdings, typical bid-ask spreads, and concentration. A focused portfolio of 30 large, heavily traded stocks behaves very differently from a 500-name small cap portfolio, even if both funds show similar assets on screen.
Use a simple participation-rate framework to estimate capacity. Take each holding’s average daily volume, apply a conservative participation rate such as 20 to 25 percent, weight by its portfolio weight, and sum across the basket. That gives you an implied daily capacity that often far exceeds ETF ADV for funds with highly liquid holdings.
In fixed income, basket analysis requires more nuance. You need to know how many bonds actually trade daily, how often the tail of smaller positions trades, and how spreads vary by rating and maturity. You also need to know whether trading is primarily on exchanges or via request-for-quote systems, because that shapes how dealers source bonds and quote sizes.
Finally, factor in market structure. How many dealers actively trade this asset class. How many venues exist for price discovery. Is trading continuous or more periodic. Those details influence how quickly the primary market can respond when you place a large order.
ANALYZE CURRENT MARKET CONDITIONS
Basket statistics only tell part of the story. Conditions on the day you trade matter just as much.
Check basic indicators like realized volatility and current spreads versus normal ranges. If spreads are wider than usual or order books look thin, assume costs will be higher and resiliency weaker. Pay attention to the calendar too, especially major macro releases, central bank decisions, and index rebalances that can temporarily strain liquidity.
For international ETFs, confirm that the underlying markets are open and trading normally if you rely on the cash market. If you trade when the local market is closed, understand that liquidity is coming from futures, depositary receipts and dealer balance sheets, which may mean wider spreads and less precise net asset value tracking.
STEP 2: Choose the Right Order Type
LIMIT ORDERS
For most ETF trades, limit orders should be your default. No drama. Just control.
A limit order sets the maximum price you will pay to buy or the minimum price you will accept to sell, which shields you from sharp price gaps during brief liquidity gaps. For Tier 1 exposures, placing your limit at or just inside the current quote often leads to quick, clean fills. For Tier 2 and Tier 3 trades, you may need to give more room and more time as trading desks work the order.
Limit orders matter most around the open and close, when spreads often widen and price signals are still settling, and in thinner ETFs where market orders can jump price levels quickly. A little patience with limits usually costs less than trying to rush the trade.
MARKET ORDERS
Market orders prioritize speed. Sometimes that is fine. Often it is not.
Use market orders sparingly and only for very small trades in highly liquid Tier 1 ETFs during core hours. In those cases, spreads are typically minimal and displayed depth is strong enough that you can get in or out without much surprise.
Avoid market orders at the open, near the close, around major news, and in any Tier 2 or Tier 3 exposure. In those environments, the risk of poor fills far outweighs any convenience you gain from instant execution.
ALGORITHMIC ORDERS
When your intended size exceeds on-screen depth by a comfortable margin, algorithmic execution can smooth the process.
Common choices include volume-weighted average price strategies, which pace your trading to the market’s volume pattern, and time-weighted average price strategies, which slice your order into equal intervals across a preset window. Implementation shortfall tools focus on minimizing the gap between your decision price and your average fill, adjusting participation as conditions change.
The key is collaboration. Work with your trading desk to select the algorithm, set urgency and risk limits, and determine whether the strategy can interact with ETF liquidity, underlying securities, futures or some combination. Many modern tools can route intelligently across these sources.
REQUEST-FOR-QUOTE AND BLOCK TRADES
For large or complex trades, particularly in fixed income and international equities, request-for-quote systems and block venues can connect you with liquidity that never appears on the standard book.
With a request-for-quote, you broadcast your interest to multiple liquidity providers, invite competing bids or offers, and select the best outcome consistent with your size and timing. For block trades, you negotiate size and price directly with a counterparty, often a market maker or primary-market participant that then manages its risk using creations, redemptions, or derivatives.
In these cases, involve your ETF trading contacts early. They can coordinate across desks, provide pre-trade cost estimates, and structure the trade so that the market sees as little footprint as possible.
STEP 3: Engage Capital Markets and Trading Specialists
USE ISSUER CAPITAL MARKETS TEAMS
Most ETF issuers maintain capital markets teams focused on trading support. For you, that is free expertise. Use it.
These teams can provide estimated execution costs at different trade sizes, implied liquidity calculations based on current conditions, and informed views on the best mix of order types and venues. They can also coordinate with authorized participants and market makers in advance of larger trades.
Build ongoing relationships with teams at issuers whose ETFs you use regularly. When you anticipate a significant trade, especially in a newer or smaller fund, a quick conversation often surfaces options you might not consider on your own.
WORK WITH BROKER ETF SPECIALISTS
Many broker-dealers now have ETF trading specialists who sit between traditional equity desks and portfolio trading desks. They understand ETF microstructure, know the active liquidity providers, and can suggest practical execution paths based on your specific situation.
Pick up the phone before entering a large or complex order. Ask whether it is better to trade the ETF directly, use the basket, or consider futures as a bridge. Ask what time of day makes sense given underlying market hours. That short conversation often pays for itself in tighter spreads and lower impact.
UNDERSTAND THE ROLE OF AUTHORIZED PARTICIPANTS
Authorized participants are the institutions that can create and redeem ETF shares directly with issuers, typically large broker-dealers or market-making firms. When you bring a sizable buy order, an authorized participant might sell you shares on exchange and then create new shares by delivering the underlying basket to the issuer. When you sell size, they can take your shares, redeem, and receive the underlying securities.
This creation-redemption loop is what allows ETF liquidity to scale beyond the visible volume on the screen. Authorized participants watch for gaps between ETF prices and net asset values and step in when the economics of arbitrage support it.
Pre-trade communication matters because advance notice gives these firms time to pre-position, arrange hedges, and line up liquidity providers. That preparation often translates directly into better outcomes for your clients.

STEP 4: Time-of-Day and Market Conditions
AVOID OPEN AND CLOSE WHEN POSSIBLE
The first 15 to 30 minutes of the day and the last 15 minutes are often the most fragile periods for ETF trading, especially for thinner funds. At the open, the underlying securities may still be discovering prices, options markets are settling, and futures are digesting overnight news. Order books tend to be thinner and spreads wider.
Near the close, rebalancing flows, closing auctions, and dealers reducing risk can all introduce noise. For broad, highly liquid ETFs, the effect is modest, but for Tier 2 and Tier 3 exposures, execution costs can rise sharply during those windows.
Whenever you have the choice, target core hours such as mid-morning through mid-afternoon, when underlying markets are most active and pricing is more stable.
MONITOR VOLATILITY AND SPREADS IN REAL TIME
Right before you trade, check the current spread and compare it to the fund’s normal pattern. If spreads are meaningfully wider, investigate why. A sector-specific headline, a macro shock, or a temporary technical issue could be at work.
In periods of higher volatility, consider stretching your execution window and reducing participation rates. Resiliency often drops in stress, which means order books refill more slowly and prices can move more on each trade.
NAVIGATE MAJOR EVENTS AND INDEX CHANGES
Maintain a simple calendar of major macro releases, central bank dates, and index rebalance schedules. Large, predictable flows around events such as broad equity reconstitutions can stretch liquidity in affected names.
For international ETFs, be conscious of local market hours. If you trade a European equity ETF late in the U.S. day, the underlying stocks are closed, and liquidity is coming from futures, depositary receipts and dealer inventories. That can mean wider spreads and more tracking noise.
ADJUST PARTICIPATION IN STRESSED MARKETS
Your usual participation rate in underlying securities, often 20 to 25 percent of average daily volume, assumes normal markets. In stressed conditions, reduce that assumption.
For example, in disrupted credit markets you might target 10 to 15 percent of average daily volume and spread large allocations over several days rather than one. This acknowledges that the market’s ability to absorb flows shrinks when volatility rises and dealers step back.
The best trading partners regularly recalibrate their recommendations as conditions evolve. When markets feel abnormal, ask them explicitly how they are adjusting their guidance.
STEP 5: Post-trade review and continuous improvement
COMPARE EXECUTION TO BENCHMARKS
After a trade completes, do not just move on. Perform a quick post-trade review.
Compare your average execution price to relevant benchmarks such as net asset value at the time of the trade, intraday indicative value, volume-weighted average price over your trading window, and the closing price if you finished earlier in the day. Express your total cost in basis points versus the mid-point spread at the time you placed your order.
For larger and more complex trades, compare realized results to your implementation shortfall target and note any gaps. Doing this consistently builds a dataset you can reference for future decisions.
ANALYZE SPREAD AND IMPACT SEPARATELY
Decompose your total transaction cost into spread cost and market impact. Spread cost is the cost of crossing the bid-ask spread, while market impact reflects how much your order moved the price during execution.
For small trades in liquid ETFs, you should see minimal market impact and costs dominated by the spread. In larger trades, especially in Tier 2 and Tier 3 exposures, impact can grow quickly. If actual impact is higher than your pre-trade expectations, review whether conditions changed during the trade or whether your participation rate was too aggressive.
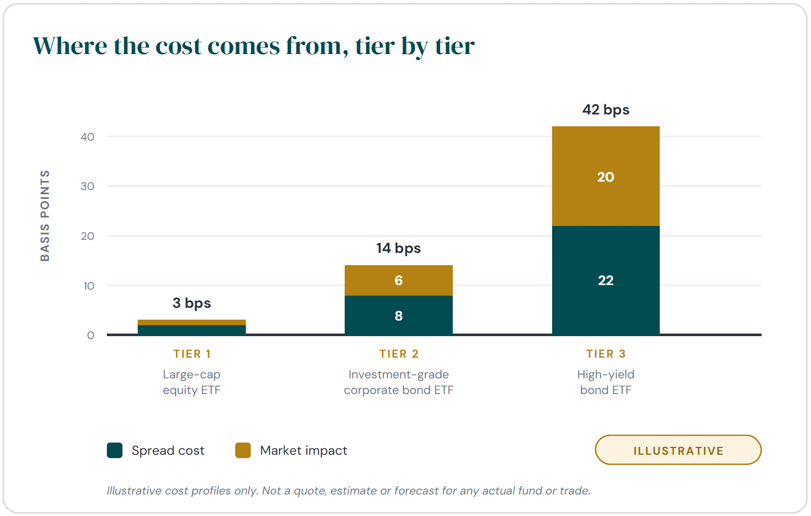
EXHIBIT 2 Spread cost and market impact shift as you move down the tiers. As exposures get thinner, market impact grows as a share of total cost. Figures are illustrative and are not a quote, estimate or forecast for any actual fund or trade.
MAINTAIN TICKER- AND ASSET-LEVEL PLAYBOOKS
Document your trading experience by ticker and asset class. Record which ETFs consistently trade with tight spreads and clean execution, which trading partners provide the best support for specific segments, and which order types have worked best.
Capture exceptions as well. Note instances where spreads widened unexpectedly, where block trades proved especially effective, or where staging trades over multiple days improved outcomes. Over time, this living playbook becomes a practical reference that saves you from repeating old mistakes.
Pay particular attention to successful trades in smaller or newer ETFs where you initially had liquidity concerns. When a 75-million-dollar fund with a deep basket delivers tight execution on a large trade, capture that story. It provides concrete evidence you can use to challenge internal myths around “bigger is always better.”
BUILD FEEDBACK LOOPS WITH TRADING PARTNERS
Schedule periodic reviews with your broker’s ETF trading desk and capital markets contacts at issuers you use frequently. Share your own post-trade data, discuss what went well, and ask what they are seeing across clients and markets.
Over time, these relationships create a shared understanding of your typical trade sizes, risk appetite, and execution preferences. That context allows trading partners to suggest better approaches, flag emerging issues, and occasionally warn you about liquidity conditions before you encounter them in a live trade.
Asset class-specific guidance
LARGE-CAP EQUITY ETFS
Large-cap equity ETFs tied to major benchmarks usually provide the smoothest trading experience. The underlying stocks are liquid, spreads are tight, and multiple firms regularly arbitrage differences between ETF prices and net asset values.
In this segment, limit orders during core hours usually suffice even for sizable trades. Capital markets engagement is more relevant for unusually large allocations or when you are evaluating newer funds where you want reassurance on liquidity mechanics. Focus more on spread width, tracking quality and exposure fit than on absolute fund size.
SMALL-CAP AND INTERNATIONAL EQUITY ETFS
Small-cap and international equity trades require more care. Small-cap baskets often include many thinner names, and international trades bring time zone and currency considerations.
Here, a deeper pre-trade basket review is important, especially for the less liquid tail of holdings. Use limit orders, consider algorithmic execution for large tickets, and prioritize windows when underlying markets are open. If you must trade outside those hours, recognize that liquidity will come from derivatives and inventories and adjust your expectations accordingly.
INVESTMENT-GRADE CORPORATE BOND ETFS
Investment-grade corporate bond ETFs are more mature than they used to be, with tighter ETF spreads, but the underlying bond market remains primarily over-the-counter. Liquidity is less transparent and can change quickly as dealers adjust their balance sheets.
Review what portion of the portfolio trades daily versus weekly or less frequently and typical spread levels by rating and maturity. Expect higher spread costs than in equities. For larger trades, use request-for-quote platforms to solicit multiple bids and involve capital markets contacts who can test dealer appetite in advance.
HIGH-YIELD AND EMERGING MARKET DEBT ETFS
High-yield and emerging market debt ETFs sit firmly in Tier 3. Many underlying bonds trade infrequently, inventories are limited, and spreads can widen rapidly during stress.
In this area, pre-trade analysis and capital markets engagement are non-negotiable. Use request-for-quote tools routinely, think carefully about size, and be ready to stage allocations when markets feel fragile. When credit spreads widen or broader risk sentiment shifts, ETF spreads will expand to reflect the actual cost of trading the bonds. That is the structure working as designed, not a structural defect.

COMMODITY AND CURRENCY ETFS
Commodity and currency ETFs that use futures or swaps live in a different ecosystem. Liquidity arises primarily from futures markets and derivative dealers rather than physical assets.
Review prospectuses and other disclosures to understand which contracts are used, how far out the curve the fund goes, and how often positions are rolled. Time your trades around the most active futures sessions where possible. For more specialized commodity or currency exposures, involve capital markets contacts who can explain current roll costs and structural quirks that influence trading costs and performance.
Common pitfalls and how to avoid them
OVERRELIANCE ON ETF SIZE AND ADV
A frequent mistake is treating fund assets and ETF average daily volume as hard limits on liquidity. This thinking comes from single-stock trading, where shares outstanding and volume matter more directly.
Instead, test these assumptions by comparing basket liquidity across funds, especially when multiple ETFs track similar exposures. You may find that a recent 75-million-dollar ETF accessing a deep benchmark trades just as effectively as an older multibillion dollar product because they draw on the same underlying liquidity.
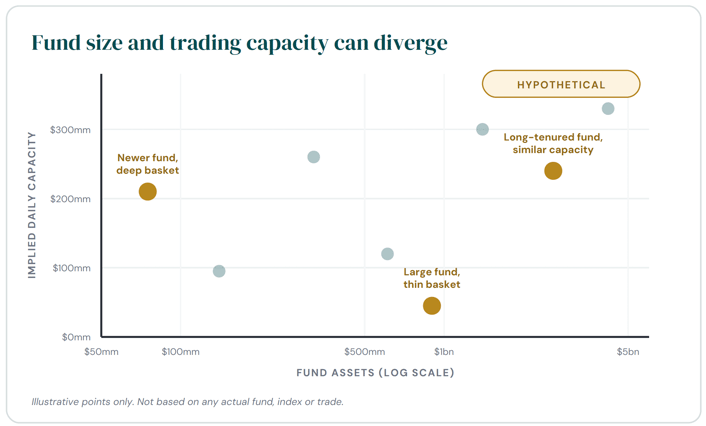
EXHIBIT 3 Fund size is not the same thing as trading capacity. Implied daily capacity estimated from a participation-rate framework can diverge sharply from headline fund assets in either direction. Points are hypothetical and do not represent any actual fund.
IGNORING RESILIENCY
Another common misstep is judging liquidity from a single snapshot of spreads and depth without considering how quickly conditions can change. Resiliency, or how fast liquidity refills after trades or shocks, is a key dimension.
Stress test your assumptions by asking what happens if volatility spikes during execution or if you exhaust visible depth. Adjust participation rates and time windows as volatility rises.
TREATING AVERAGE DAILY VOLUME AS FULLY ACCESSIBLE
Average daily volume statistics can mislead if you assume you can access that volume evenly throughout the day at consistent cost. In practice, volume often clusters around the open and close and splits across different venues with varied access.
In fixed income, some bonds might not trade at all on particular days, which makes average daily figures less meaningful. Refine your view by studying intraday patterns, venue fragmentation, and realistic access to volume, ideally using analytics from trading partners.
USING MARKET ORDERS IN ILLIQUID EXPOSURES
Using market orders out of habit in thinner ETFs, especially near the open or close, can produce unpleasant fills as you sweep multiple price levels.
Make limit orders your default for anything outside very small trades in highly liquid Tier 1 names. When you truly need speed in a thinner ETF, involve a trading desk that can work the order intelligently instead of simply hitting the market.
FAILING TO ADJUST FOR STRESSED MARKETS
Finally, do not run the same playbook in stress that you use in calm conditions. Static participation rules and narrow windows that work “most days” can become unsafe when volatility spikes, spreads widen, and dealers reduce risk.
Build clear, pre-agreed adjustments that turn on when volatility, spreads, or other risk measures cross defined thresholds. This might include smaller participation rates, longer windows, mandatory capital markets engagement, and additional internal approvals for large trades.
Conclusion
Effective ETF
trading blends structural knowledge with consistent habits. When you focus on underlying basket liquidity instead of surface metrics, choose order types and timing thoughtfully, engage trading specialists, and review your results, you turn ETF trading from a source of anxiety into a repeatable process.
The creation and redemption process breaks the simplistic link between fund size and tradability. Once you adjust your mindset, you can use smaller, more precise ETFs confidently, as long as the underlying markets support your trade size and timeline. Over time, applying this playbook builds a deeper institutional memory around ETF trading that benefits both you and your clients.
DISCLOSURES
Carefully consider the Fund’s investment objectives, risks, charges, and expenses before investing. This and other information can be found in the Fund’s statutory and summary prospectuses, which may be obtained at CapForceETF.com. Read the prospectus carefully before investing.
Investing involves risks. Principal loss is possible. The Fund's return may not match the return of the Index. Along with general market risks, an ETF that concentrates its investments in the securities of a particular industry, market, sector, or geographic area may be more volatile than a fund that invests in a broader range of industries. Additionally, the Fund may invest in securities that have additional risks. Foreign companies can be more volatile, less liquid, and subject to the risk of currency fluctuations. This risk is greater for emerging markets. Small- and mid-cap companies can have limited liquidity and greater volatility than large-cap companies. Also, ETFs face numerous market trading risks, including the potential lack of an active market for Fund shares, losses from trading in secondary markets, periods of high volatility and disruption in the creation/ redemption process of the Fund.
The IBD® Breakout Stocks Index is the fund’s underlying index and is a proprietary index calculated by Investor’s Business Daily® that seeks to identify stock breakout opportunities, or stocks poised to experience a period of sustained price growth beyond the security's recent "resistance level", with consideration for various market conditions.
The "IBD®" mark and logo have been licensed to the Adviser by Investor’s Business Daily,® ("IBD") for use in connection with the Fund under certain circumstances. The Fund is not sponsored, endorsed or sold by IBD. IBD makes no representation regarding the advisability of investing in the Fund. The Investor's Business Daily mark and associated logos are used with permission by IBD.
Neither CapForce ETF, Foreside nor Investor's Business Daily® are related.
CapForce ETFs are distributed by Foreside Fund Services, LLC.
Capital-FORCE Welcomes IBD® 50 (FFTY) and IBD® Breakout Opportunities (BOUT) ETFs to New Rules-Based ETF Platform
Investing Greatness – The History Of Great U.S. Investors